RISKOPILOT Editorial Team, 4 min read
Why injury rates do not predict fatalities
TRIR and LTIFR measure how often people get hurt. Fatal risk follows a different mechanism, and boards need a different instrument.
Riskolabs shows boards and HSE leaders whether the controls against fatal energy are in place and working, before anyone is exposed.
Methodology proposal v2.0 by RISKOPILOT · validation protocol published
| Year | Fatalities | Recordable injuries per million hours |
|---|---|---|
| 2012 | 90 | 5.07 |
| 2013 | 91 | 4.52 |
| 2014 | 56 | 4.50 |
| 2015 | 60 | 4.70 |
| 2016 | 63 | 4.26 |
| 2017 | 50 | 3.94 |
| 2018 | 50 | 3.41 |
| 2019* | 37 | 3.20 |
| 2020 | 44 | 2.94 |
| 2021 | 45 | 2.90 |
| 2022 | 33 | 2.66 |
| 2023 | 35 | 2.59 |
| 2024 | 43 | 2.29 |
| 2025 | 39 | 2.21 |
Injury rates count frequent, low-energy harm. Fatalities come from a barrier against high energy that is missing or fails on the day. One number cannot see the other.
Sources: Construction Safety Research Alliance (Hallowell et al., 2021); ICMM (2026).
ICMM itself warns that injury performance is not a proxy for fatality risk.
A critical control is crucial to preventing a fatal-energy event or limiting its consequences; its failure would significantly raise the risk despite the other controls. To count, it must pass three tests.
Training, procedures, permits and signage keep controls healthy. They are degradation controls, not barriers, and score no protection.
Before a high-energy task starts, every critical control is verified in the field. Each is either verified (1) or not (0), and the gate is their product. Evidence that is only a document scores 0.
Try it: select a control to mark it as failed.
G = v₁ × v₂ × … × vₙ = 1 × 1 × 1 × 1 = 1All four verified. Work may start.
Each barrier earns points according to how much it relies on people. One point is roughly a tenfold reduction in risk.
| Passive engineering | guardrail, fixed guard, separation | 2.0 |
|---|---|---|
| Automated engineering | interlock, trip, proximity slowdown | 1.0 |
| Human-activated engineering | lockout with test, alarm with response | 0.5 |
| Active human barrier | spotter with stop authority | 0.3 |
| Personal protective system | anchored fall arrest | 0.2 |
| Fails the direct-control test | training, procedure, signage | 0.0 |
The Organisational Resilience Factor (ORF) is the lowest of three indicators, never their average.
Five indicators, worst first. E1 (gate failures) is always read with O3: few gate failures with many false passes means checks are completed on paper. E2 measures the share of fatal-energy exposure protected by less than one point.
An averaged score is never used: it can hide the one crew exposed today.
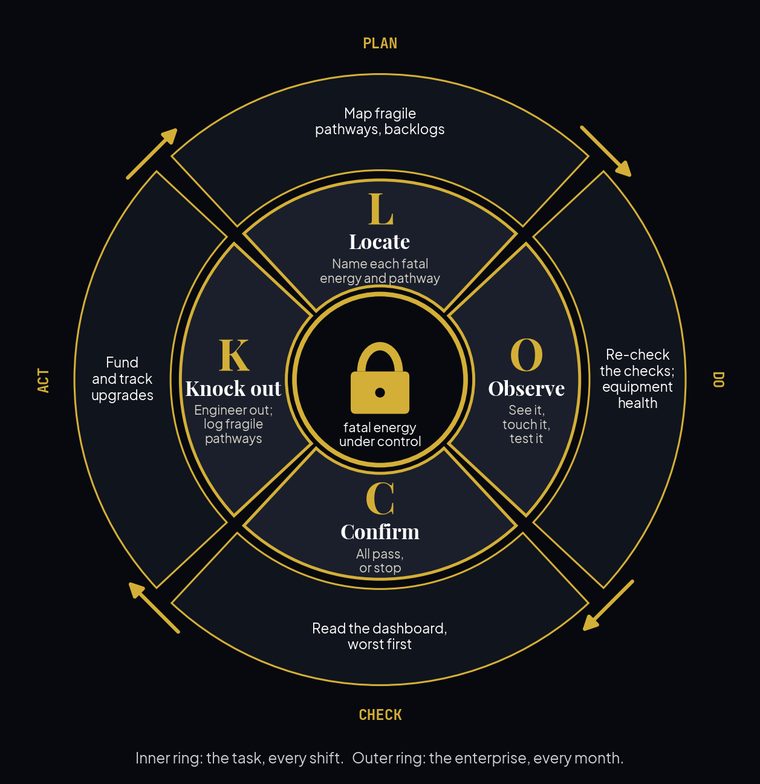
Crews run the inner loop at every task; the enterprise runs the outer loop every month. Each knock-out redraws the pathway map, so improvement is built in, in line with ISO 45001 and double-loop learning.
Every recommendation starts with eliminating the energy or reducing it below the fatal threshold, then engineering (passive before automated), then keeping engineered barriers working. Verification and culture keep barriers honest but add no protection; administrative measures and personal protection are interim only.
Version 2.0 is a proposal. It may be called piloted after phases A to C, and validated only after phase D.
Limits: answers and checks are self-reported, points are conventions, and the association between CCHI and fatal outcomes has not yet been demonstrated on field data.
An interactive demonstration that runs in the browser. A fictional company, Veyra Minerals, shows the method end to end; the assessment applies it to your own organisation.
Simulation parameters are illustrative and pending expert review. Your assessment answers stay in your browser.
Six screens from the live lab. Use the buttons or the arrow keys.
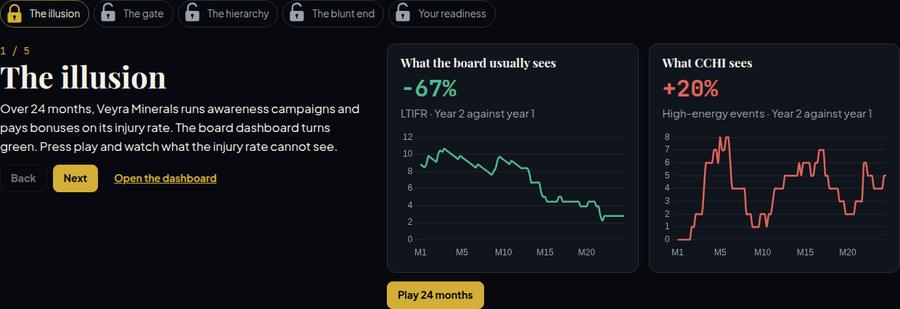
Watch the injury rate fall while high-energy events rise, open a gate, and move a pathway up the hierarchy.
The CCHI lab opens to early-access members first, while its simulation parameters complete expert review.
The CCHI lab replays three major accidents from their official investigation reports. In each, the organisation believed protection was in place: 1.5 points at Buncefield and Piper Alpha, 0.5 at Texas City. The true protection when the demand came was 0.
On 300 simulated companies, when serious events are rare, as in most real operations:
| Signal | Ranking power, from the next quarter to 9 months ahead |
|---|---|
| CCHI score | 0.62 to 0.72 |
| Counting past events | 0.51 to 0.59 |
| LTIFR | 0.46 to 0.64 |
Ranking power (AUC): 0.5 is a coin toss. This is in-model evidence: the simulation assumes that failing controls drive high-energy events. Field validation (phase D) is the real test, and the lab states what would disprove the claim.
The CCHI lab opens in stages, and the methodology documents are sent by email. Tell us about your operations; we confirm your email, then send what you asked for.
In-depth articles, the full methodology, and the official sources behind this page.
RISKOPILOT Editorial Team, 4 min read
TRIR and LTIFR measure how often people get hurt. Fatal risk follows a different mechanism, and boards need a different instrument.
RISKOPILOT Editorial Team, 4 min read
A permit is not a barrier. The CCHI gate turns critical control verification into a stop-or-go decision.
RISKOPILOT Editorial Team, 5 min read
Checks, training and procedures keep barriers healthy. Only elimination and engineering take fatal energy away from people.
Sent by email after a quick confirmation.
Free to download, in four languages.
Riskolabs is RISKOPILOT’s home for interactive risk tools. Its first tool, the CCHI lab, lets boards and HSE leaders explore critical control health on a simulated company and assess their own organisation.
Critical control health is a method to verify, before exposure, that critical controls against fatal energy are present and working, and to rate each fatal-energy pathway along the hierarchy of controls. It gives boards five indicators and a readiness stage set by the weakest.
Injury rates mostly count low-energy events, while fatalities come from high energy reaching a person through a missing or failed barrier. The largest statistical study of the recordable injury rate, on 3.2 trillion worker-hours, found no discernible association with fatalities.
Not yet. Version 2.0 is a proposal with a published four-phase validation protocol. It may be called piloted after phases A to C and validated only after phase D.
Request early access on this page. You confirm your email, we review the request within 2 business days, and you receive a personal link valid for 30 days. The 2-minute tour is open to everyone.
Yes. Take the 2-minute tour on this page, or choose “A 30-minute guided demo” in the form; we reply by email with proposed times.
Ask for them in the same form. They arrive by email as soon as you confirm your address; no review is needed.
No. The assessment runs in your browser and your answers are stored only on your device. You can clear them at any time or save them as a file.
No indicator can predict a specific accident. In simulation, when serious events are rare, CCHI ranks the risk of the coming months better than counting past events, and more consistently than the injury rate. Validation phase D will test whether this holds on field data.
No. Tripod Beta explains why barriers failed after an event; CCHI verifies barriers before exposure. Red CCHI indicators point to the basic risk factors an investigation would examine.
A pilot covers two to three sites for at least twelve weeks, with the gate, the pathway register and independent re-checks. Choose “A pilot discussion” in the form.
Start with the free CCHI Rollout Playbook in the method section: ten conditions before day 1, a first site in 100 days, then extension site by site, each stage ending at a gate. It is available in English, French, Spanish and Portuguese, with no email needed.
Start with early access to the CCHI lab and its assessment, then test the gate and the pathway register on two or three sites.